1. What is an org chart builder?
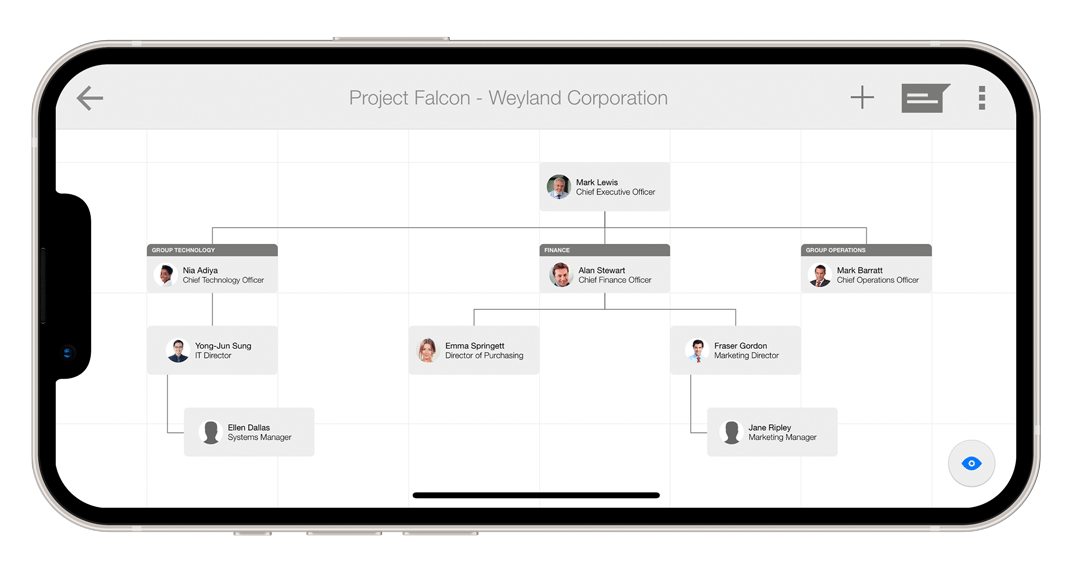
An org chart builder lets you create org charts. Org charts or organisation charts are visual illustrations that show the internal structure of an organisation. These illustrations show the distribution of rank across the structure of the organisation relative to the job functions within it. Employees within an org chart are often represented by box shapes, which often include text data such as name and job title, but sometimes include a photograph and contact information.
Relationships in org charts are sometimes called chain of command, which depicts supervisor to subordinate relationships, as well as lateral relationships which show individuals at the same level. When an org chart becomes too large to be useful, they can be easily split into smaller departmental charts. Org charts can also be known as Organograms or Organogram Charts.
Org charts are used in several places across the enterprise:
Sales – Org charts can be used to help sales executives, account executives and business development managers better understand the hierarchy of a customer organization. An org chart helps the sales professional understand the broad responsibilities of the individuals they must engage within the hierarchy.
Customer Success – As well as sales, customer success managers use org charts when starting a new role or adopting a new set of customer accounts. Org charts help the customer success manager navigate the organisational hierarchy and its distribution of power.
Project Managers – Current-state and future-state org charts are used by project managers to manage the scope of a project as it transitions from it’s initial owners to a permanent team.
Human Resources – Org charts can be used for resource planning to help HR managers understand areas of under-staffing within an organisation, to fill skills gaps and grow the business in the right direction. Org charts help new hires get up to speed with where individuals fit into the operation of the business, also helping them to understand where they fit into the overall structure of the corporation.
Business Leaders – Org charts are used to help business leaders or owners understand areas of over-staffing with an organisation, to enable a more efficient distribution of resources. Org charts are heavily utilised following mergers and acquisitions.
2. Why use an org chart builder?
There are several reasons for using an org chart builder:
1 – It’s impossible to remember every director, manager and worker within an organisation. Using an org chart app, provides a reference you can refer to quickly when you need to understand who to contact or target.
2 – Creating an org chart within an illustration or drawing application takes an incredible amount of time, as you draw boxes, lines and type out names and job titles. An org chart app automates the drawing process, so you only have to populate the data within it.
3 – Maintaining org charts within desktop apps like PowerPoint is mundane and tedious. You are far more likely to keep an org chart up to date if it synchronises with your address book.
4 – Sharing large PowerPoint or illustration files often means creating attachments with big file sizes. Sharing org charts from an applications, removes the creation of large files.
3. History of org charts
Hierarchies which are the foundation on which org charts are created, have existed before people existed. Jordan B Peterson, University of Toronto professor argues lobsters a species which is 350m years old adopts a dominance hierarchy.
The first org chart was invented in 1855 by Daniel McCallum a Scottish-born American railroad engineer and general manager of the New York and Erie Railroad. George Holt Henshaw a Canadian engineer and draftsman is credited with drawing the first org chart. The first org chart was referred as a “Diagram representing a plan of organization exhibiting the division of administrative duties. Showing the number and class of employees engaged in each department from the returns of September 1855.” As its long title suggests, the diagram depicts the multiple divisions of duties, and the number and roles of employees in each department of the railroad.
Daniel McCallum, the inventor of the Org Chart believed in the division of responsibilities and the importance to make roles and responsibilities transparent. By drawing a diagram, a sense of order and control could be established and hierarchical relationships could be better understood. The term ‘organizational chart’ didn’t come into common use until 1920. Willard C. Brinton an engineering consultant used the term in a 1914 textbook, Graphic Methods for Presenting Facts. He promoted the use of org charts.
In 1917, a new type of organizational chart was created by Herman McCallum, founder of the Computing-Tabulating-Recording Company (CTR). McCallum was awarded a federal contract to develop a machine to count the influx of immigrants into the United States at the height of the Industrial Revolution. McCallum is credited with creating the modern org chart design we use today, which adopts a symmetrical, pyramidal form. The company continued to grow and evolve and in 1924 was finally renamed International Business Machines (IBM).
Org charts were mainly used in engineering circles until the 1920s, when they began to find their way into the business world. It wasn’t until 1960 that rapid economic growth led to product consumerization which expanded the range of products and variations of products to meet growing consumer needs.
4. Types of org chart
There are three different types of org chart: Hierarchical, Matrix and Flat. Hierarchical is the most common. Each type has advantages and disadvantages. How an org chart is structured largely depends on how company leaders view work processes and the nature of the team that must deliver it. As cultural shifts, market demand, competition and economics impact the organisation, a companies org chart may change.
Hierarchical Org Charts are the most common type of org chart today. A hierarchy is a system in which members of an organization or society are ranked according to relative status or authority.
Matrix Org Charts are used when individuals have more than one manager. For example, an organization could have a team of project managers who all report to the Head of Business Administration. Each project managers works on a different project which has its own business unit sponsor. In this case, the project manager will have two managers.
Flat Org Charts have little or no level of middle management and usually consists of two levels. The management and the staff. In flat structures the staff have greater responsibility and are more directly involved in decision making.
5. Limitations of org charts
1 – Any Org chart is out dated as soon as it’s created. This is especially true in large organizations where employees leave, join or are promoted frequently.
2 – Org charts only show formal relationships. The reporting lines show the flow of hierarchical power, but do not take into account lines of influence hidden within the structure.
3 – Org charts provide no indication of managerial style. Although the chart shows hierarchy it gives little indication to how autocratic the organisation’s management are.
4 – Org charts only include employees and often omit consultants and contractors who can have great influence within a hierarchy.
5 – The strength of a Hierarchical Org Chart is clarity and stability, its weakness is rigidity, and an inability to be flexible when called for. The management layers often bloat an organization as well.
6 – In a Matrix Org Chart the cross-department relationships are often more collaborative and cooperative. Its weakness is they tend to suffer from conflict as more than one person or department to answer to can also create confusing loyalties.
7 – Flat Org Charts are simply unpractical for larger organizations. Employees may feel a stronger sense of autonomy and influence but conflicts among employees can become more pronounced due to a lack of clarity of who makes the final decision.


